As a continuation after understanding Virtual Memory in the previous article, this article tries to explain theways to monitor the same.
Memory can be looked at with two perspectives: Utilization and Saturation.
Utilization tells the memory usage. Checking free/used memory reflects the Utilization.
Saturation tells if the memory is used at its full capacity and how the system is using Virtual memory to deal with memory crunch.
In other words, if demands for memory exceed the amount of main memory, main memory becomes saturated. The operating system may then free memory by employing paging, swapping, and, on Linux, the OOM killer. Any of these activities is an indicator of main memory saturation.
Also, it is important to understand that Paging and Swapping are two different things. More details about the same in the previous article.
Although there are more than one ways of measuring these metrics, lets use sar and vmstat to look in to the same.
Paging:
- sar is an easy go-to tool for measuring paging metrics. – “sar -B 2” — (-B signifies Paging Statistics).
- From the below metrics, I would closely look at – majflt/s, pgfree/s, %vmeff.
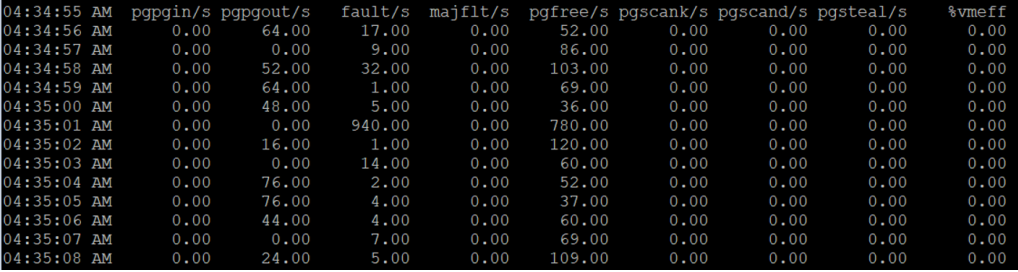
- Pgpgin/s & pgpgout/s — This reflects the total kilobytes paged in and out of the disk per second by the system. This is not same as swapping. Paging activity can increase when running a simple program, to get certain part of the code off to the disk or back to the memory.
- Faults/s — This is the total of minor+major faults that the system had to deal with. This is not a count of only page faults that generated IO’s, since Minor faults are resolved without requiring I/O’s.
- Majflts/s — This is a key metrics. This measures the disk read activity that were needed per second, as the memory page was loaded from the disk. A constant high number for major faults indicates that the process is running slow, as it is interrupted too often to read the pages from the disk. This is a good indicator to check if there is a memory crunch. You will see a lot of major faults if the pages loaded in the memory (cache section on running the command “free -m”) previously are thrown out due to shortage of memory and are re-requested again as they are actively worked on.
- pgfree/s — This accounts for the number of pages placed in the free list by the system. Free list is a list of pages that are unused and are available for immediate allocation, idle memory in other words. So, a large value here mean there were corresponding pageouts.
- pgscank/s & pgscand/s — These refer to the number of pages scanned by background page-out daemon and also directly.
- pgsteal/s — These are the number of pages the system has reclaimed from the cache to meet the memory demands.
- %vmeff — This is an interesting metrics to measure the reclaim efficiency. This is the ratio of Page Steal/Page Scan. Higher value means, most of the pages scanned are stolen back and are freed. If it is 100%, then every page scanned is freed. If it is low (less than 30%), VM is having difficulty freeing the memory. The field would be zero if no pages are getting scanned. So I would be happy to see either zero or 100% here.
Swapping :
- vmstat is an easy tool to look in to swapping details — “vmstat -S M 2“
- vmstat gives details of memory, cpu, io, run queue length and not just swap details.

- The swap section here talks about the swapping happening in the system.
- si / so : These values represent the amount of memory swapped in from the disk and the amount of memory swapped out to the disk. In the above example there is no swap happening at all. These values give a representation of memory saturation of the system.
Although, majority of the focus goes in to Memory Utilization during performance testing, it is important to keep an eye on memory saturation as well. Memory saturation measures the systems capacity to handle the memory crunch if it occurs.
Happy tuning.
